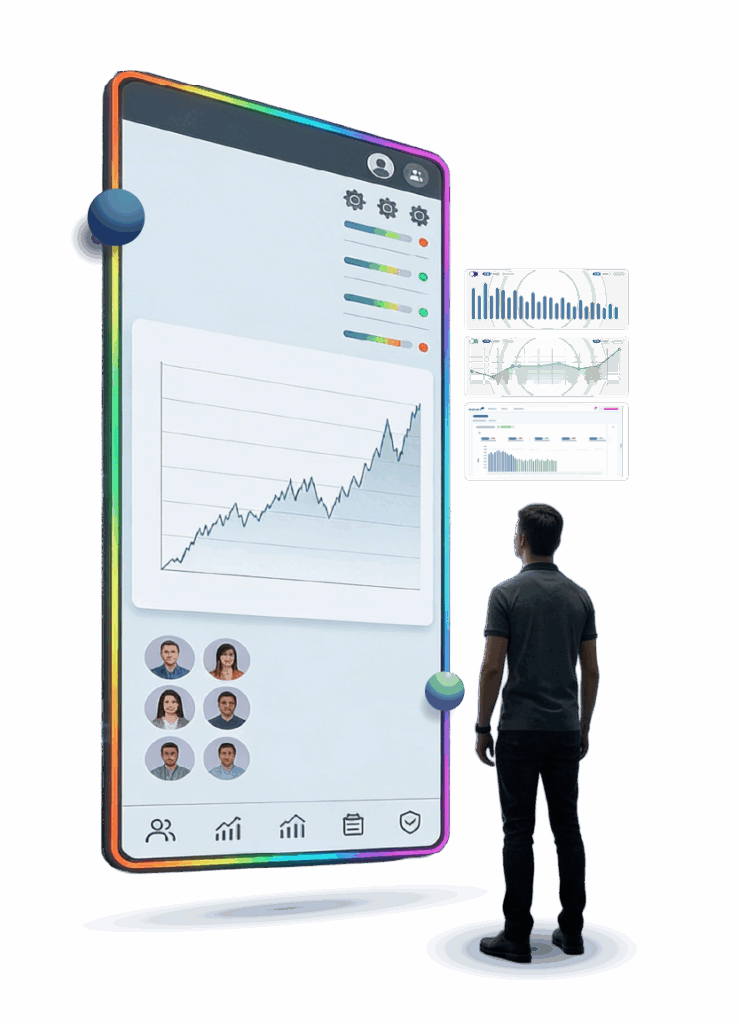
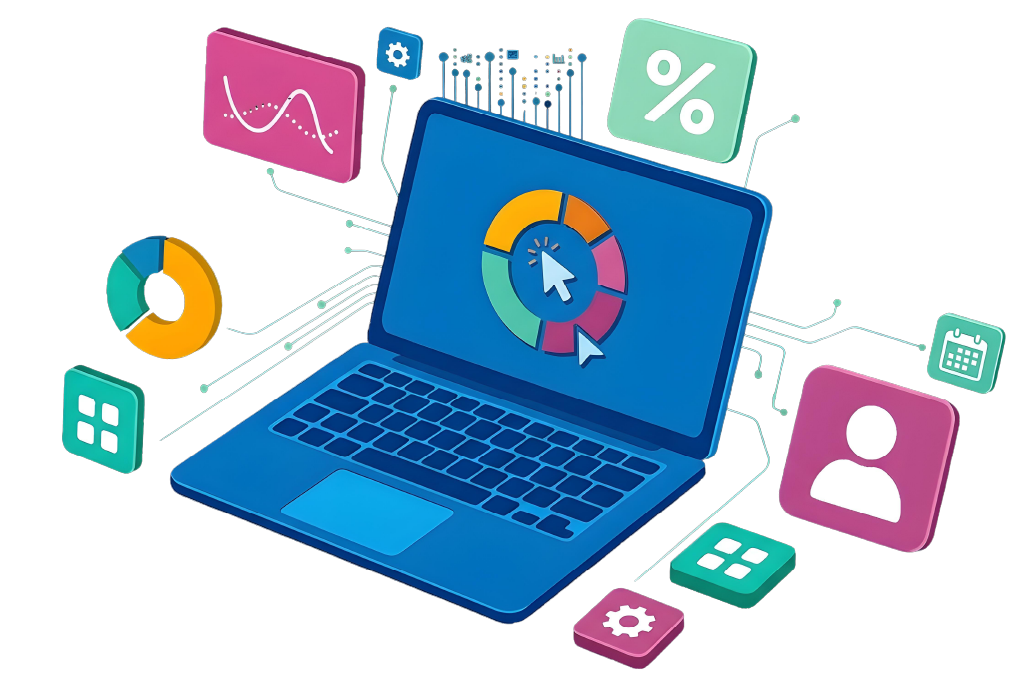
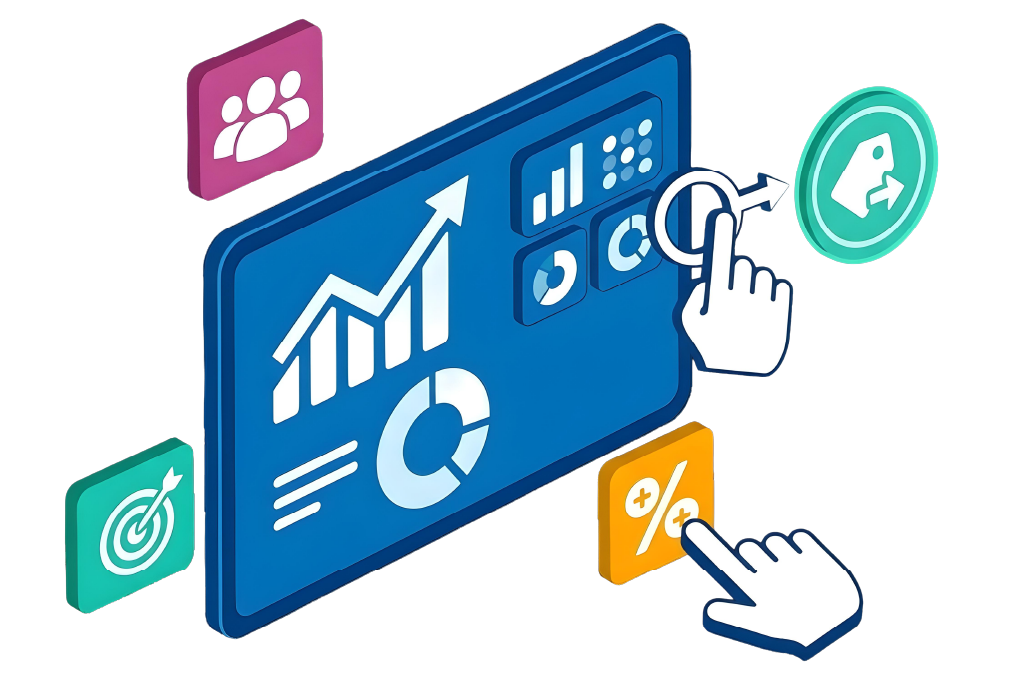
The right information for each role, at the exact moment

Centralize sell-out, stock, and key indicators from each point of sale on a single platform so your team can detect opportunities, prioritize actions, and make better business decisions before losing sales.

Everything your team needs to make better decisions

A centralized, intelligent, and easy-to-use platform that turns data into real business opportunities.

A single source of truth

Centralizes information from retailers, distributors, and other sources.

Role-based dashboards

Each user only views the information they need to take action.

Always updated data

Eliminate manual processes and work with reliable information.

Faster decisions

Detect opportunities before they turn into lost sales.

The before and after of executing with Teamcore

The problem


The data is scattered, incomplete, and outdated.

Office teams spend hours downloading information from multiple B2B portals, consolidating files, and validating data before they can analyze what is happening.


  • Hours wasted crossing information and making decisions with incomplete, inconsistent, and unreliable data.
  • Delayed decisions based on data that no longer reflects reality.
  • Opportunities lost before being detected and actions without impact.
Visibility-rainbow-icon

The solution


A single source of truth for the entire organization.

Visibility centralizes information from retailers, distributors, and other sources into dashboards with views customized by role, region, customer, and period, so that each team has access to the information they need, when they need it.


  •  Centralize and consolidate the main KPIs.
  •  Updated and reliable information in real time.
  •  Detect opportunities and act before losing sales.

Visibility that drives results

Centralize channel data, customize your view by role, and turn indicators into concrete improvement opportunities.

Turn scattered data into business decisions

A simple process that transforms information into business opportunities.

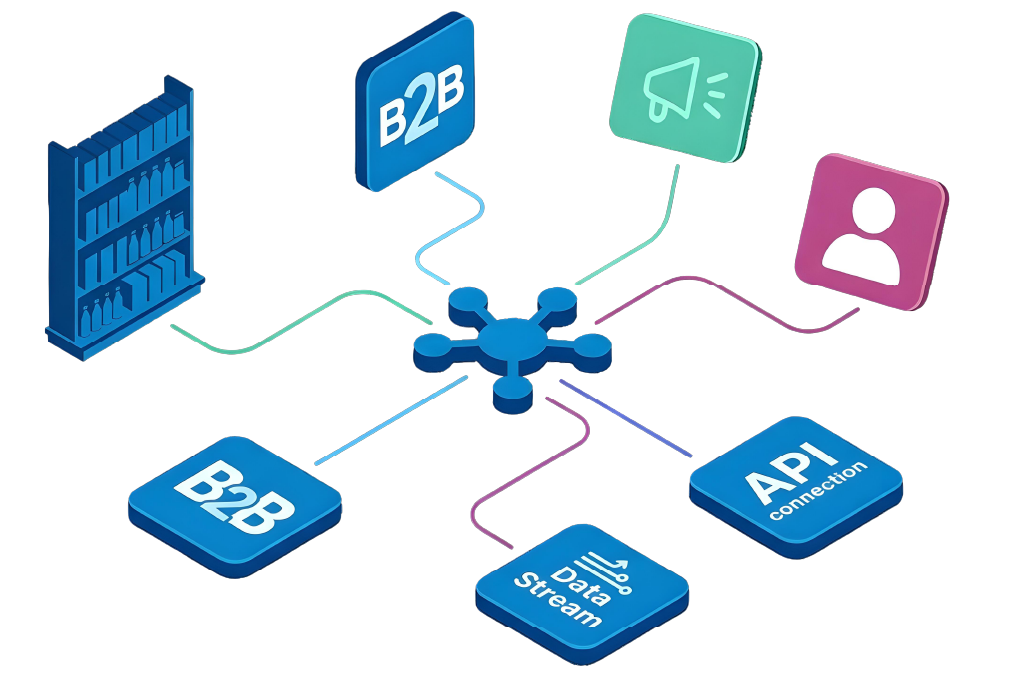
1. Connect

Automatically integrate the information from your B2B portals.

2. Centralize

Consolidate sales, stock, and KPIs into clear and personalized dashboards for each role.

3. Act

Detect opportunities, identify deviations, and make decisions with reliable and up-to-date information.

What changes for your team

Visibility transforms the way your organization works with information so that they can make better decisions and generate more impact.

Reduce the time on reports

Eliminate manual processes and hours spent downloading, consolidating, and validating information.

Detects opportunities before losing sales

Identify stockouts, deviations, and changes in behavior in real time.

Prioritize actions with the greatest impact

Centralize and standardize the information so that everyone works with the same data.

Aligns the entire organization

All teams see the same indicators and work toward the same objectives.

Blue-options-icon

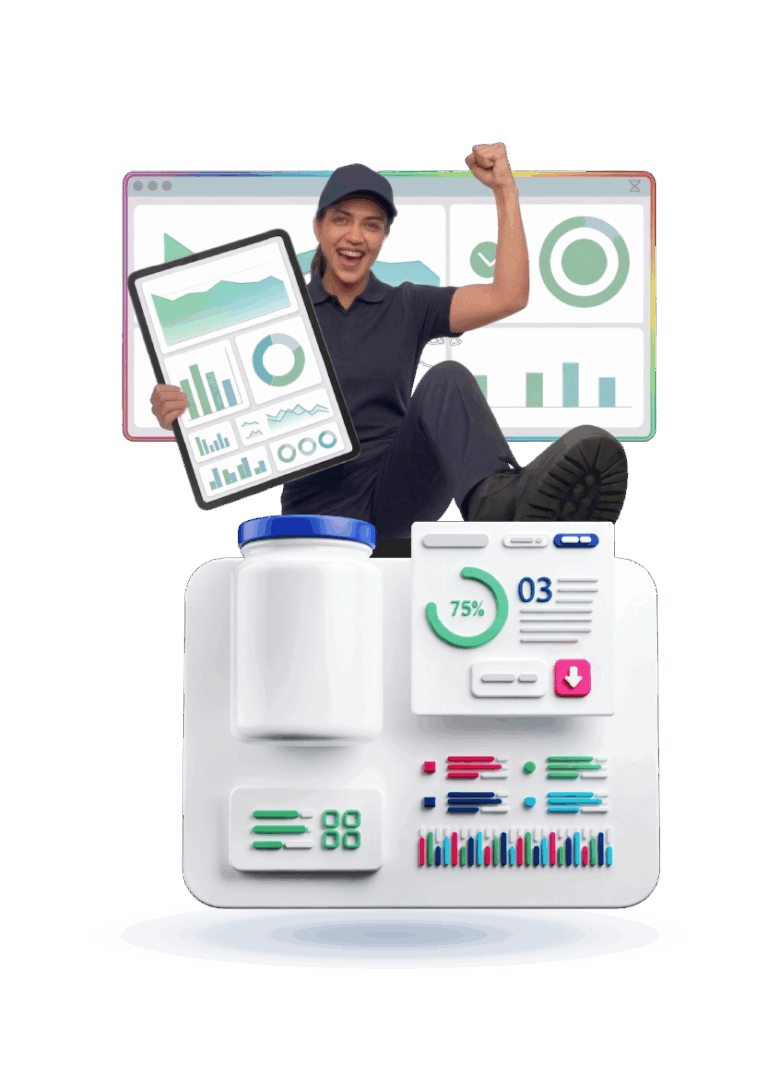
Measure what matters, manage what impacts

Dashboards and real-time KPIs so that each team has visibility into commercial performance and makes data-driven decisions.

Benefits of our KPIs:


  • Real-time visibility: Monitor your key indicators in real time and from anywhere.
  • Data-driven decisions: Act on reliable and up-to-date information to generate more impact.
  • Total team alignment: Everyone works with the same data, objectives, and priorities.
  • Focus on results: Prioritize what moves the needle for your business the most.


Everything you need to monitor business performance

Visibility brings together all the tools your team needs to have complete visibility, detect opportunities, and make better decisions, faster.

Growth-3-blue-icon

Sell-out and Stock Analytics

Visualize commercial performance by customer, category, product, region, or period.

Blue achievement icon

Achievement of goals

Monitors business objectives and identifies deviations in real time.

Blue-flow-icon

OSA Monitoring

Measures the availability of your product on the shelf/rack.

Blue edition icon

Customizable Views

Set up your favorite indicators and organize your view according to your priorities.

Blue-flow-icon

Data Downloader

Download and share the most important indicators with your entire team.

Blue-Org-Chart-Icon

Agile self-management

Manage users, products, points of sale, and permissions from a single place.

The right information changes the way you execute.

When everyone works with the same information, decisions are made faster, opportunities are seized sooner, and business execution improves at every point of sale.