Black Friday / El Buen Fin se gana antes: la guía de punto de venta para marcas de consumo masivo

Del 13 al 30 de noviembre, Latinoamérica vive sus descuentos más intensos del año. El resultado se define en la góndola: producto disponible, precio correcto y exhibición armada.
Tiendas de barrio en Colombia: qué cambió en el canal tradicional en agosto de 2026
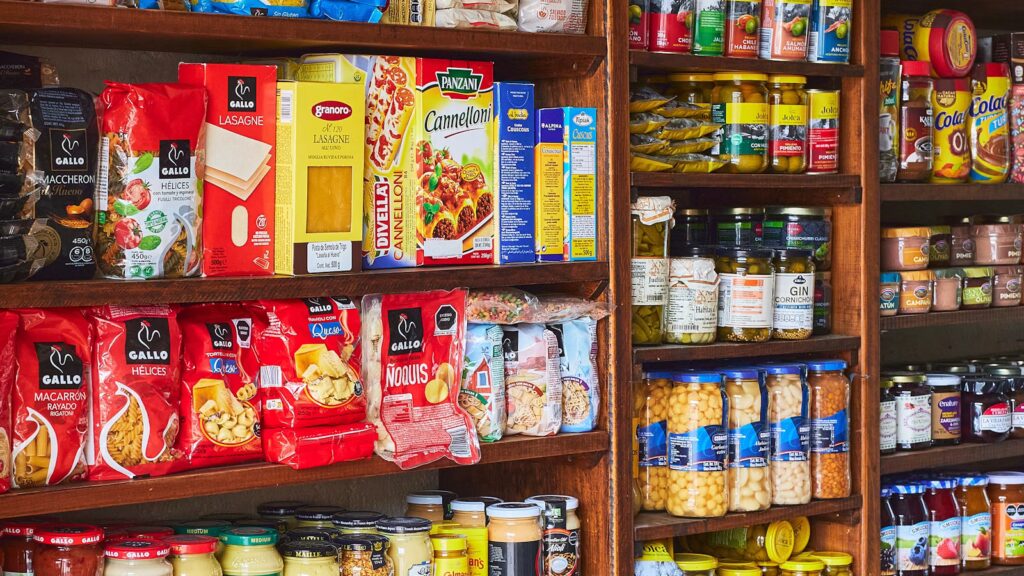
Revisamos los pedidos que las tiendas de barrio le hicieron a sus distribuidores durante agosto para entender qué cambió en el canal tradicional del país. Esto es lo que encontramos en 182 subcategorías.
The future of the point of sale: 5 trends redefining the POS in Latin America

How technology and data are changing the way every point of sale is managed.
When consumption changes its route, execution does too

Consumers have changed. Has your sales strategy changed too? Mid-year vacations in Latin America: In July, consumer spending doesn’t grow evenly—it shifts. And that redistribution becomes an opportunity—or a lost sale—depending on what happens on each store shelf. 48.3 million tourists traveled in Mexico during the summer (Sectur); purchases in Peru grew by 251% Q3-Q2 in July (LigoPay) $829 thousand M in tourism spending in Mexico, +6.3% year-over-year (Sectur) 1.88M domestic tourists during Peru’s Independence Day celebrations (Mincetur) CONTINUE READING During the mid-year break, spending skyrockets: in Mexico alone, more than 48 million tourists travel, and in Peru, purchases grow by 25% compared to a typical month. But this surge is not evenly distributed. Schedules, routes, and the retail locations where demand is concentrated change; some stores welcome new shoppers, certain product categories see faster turnover, and promotions compete for increasingly fragmented attention. For manufacturers and retailers, this activity presents an opportunity, but also an operational challenge: understanding what’s happening in each store and taking action before a stockout, an incomplete display, or a delayed restock results in lost sales. Beyond anticipating the season, the key lies in identifying what’s happening at each point of sale and reacting in a timely manner. In July, millions of families across the region change their routines, their destinations, and their shopping locations. In July, consumer spending shifts—and concentrates. July is one of the busiest months for commerce in the region. In Mexico, the Ministry of Tourism estimated a flow of 48.3 million tourists during the summer and tourism spending of 829 billion pesos, a 6.3% increase over the previous year, with more than 34.8 million students on vacation driving spending at 4.8 million retail locations. In Peru, bonus payments and the Fiestas Patrias drive purchases 25% higher than in a typical month, and the average receipt amount rises. The point isn’t just that people are spending more—it’s that this spending is shifting. It’s moving toward tourist destinations, transportation hubs, markets, and food districts, as well as toward categories such as food, beverages, snacks, personal care, and children’s products. Other typical areas, on the other hand, are seeing a slowdown. How much does consumption shift during the July campaign? Peru · domestic spending: July vs. a typical month — LigoPay+25% Peru · National Holidays spending vs. previous weeks — Niubiz+16% Mexico · summer tourism spending vs. 2024 — Sectur+6.3% Colombia · Household spending in June, start of summer break — Raddar+5.3% Each bar measures a different consumption variable linked to the July campaign; they are shown together only to indicate a general trend, not as a direct comparison between countries. Sources: LigoPay (Peru), Niubiz (Peru), Sectur (Mexico), and Raddar (Colombia). Sales Are Won on the Shelf More demand does not guarantee better results. If the product isn’t on the right shelf, with the right price and display, the opportunity simply disappears. And at the peak of a campaign, that gap on the shelf comes at a high cost. On-shelf availability (OSA) is the point where demand turns into a sale—or doesn’t. 01TP1 They’ll go to another store. When the product isn’t there, the sale doesn’t wait. Between 20% and 30% of retail sales are lost due to out-of-stock situations, poor display, or restocking errors. 60% of customers who can’t find the product they’re looking for buy it at another store. 72% of stockouts stem from internal process failures: orders and restocking at the wrong time or in the wrong quantity. Stockouts · global average 8.3% Stockouts · Chilean market 15.7% The real cost: that level of out-of-stock incidents equates to approximately 3.9% in lost sales for the retailer and 2% for the supplier—per campaign, in every category. During a demand peak, this figure multiplies. Sources: estimates of shelf out-of-stocks by Beetrack / University of Chile, Kaizen Institute, and Vision Retail. The peak shifts throughout the season. Within a single market, the holiday season does not concentrate demand on a single date. It begins to pick up in the weeks leading up to the holiday—when households shop for their trip—skyrockets when families set out (on highways, at bus terminals, and at destinations), remains steady during their stay, and spikes again upon their return, this time in urban and residential areas. For retail operations, this means that two stores in the same chain may experience their peak in different weeks depending on their location. The national average averages all of this out and obscures the exact moment when each store needs to be at its best. Pre-Departure | Stay | Return | Pre-trip shopping at home | Peak on routes, at terminals, and at destinations | Sustained consumption in destination areas | Rebound in urban and residential areas How demand shifts throughout the campaign: an illustrative sequence based on travel and consumption patterns during the holiday season; its exact form varies depending on the market, format, and location of each store. Reference data: Sectur (Mexico) and Mincetur (Peru). And during this window, it’s not just the “where” that changes—it’s also the “what.” Today’s Latin American consumer is more strategic—shopping at smaller formats, prioritizing promotions, and increasingly choosing private-label brands—so the categories that are gaining momentum and the way they’re stocked shift in tandem with the timing and location. Source: Kantar, The 2025 Consumer in Latin America. Across much of the region, the traditional retail channel accounts for a significant portion of that demand. How Teamcore Fits In Teamcore connects data, priorities, and execution so that the sales team doesn’t have to rely on improvisation. Seasonal management is structured around four capabilities: 01 Detect changes in demand Analyzes sales performance by store, product, area, and period to identify opportunities or deviations. 02 Ensure shelf availability Prevents the most in-demand products from remaining in the warehouse, being poorly displayed, or selling out just when the
The tournament has started. Your gondola is playing too.

Temporada de fútbol y tu góndola — Teamcore Blog Retail & CPG · Tendencias Junio 2026 · Teamcore Editorial Durante la temporada de fútbol. Tu góndola también sale a la cancha. La temporada de fútbol mueve horarios, reuniones y compras de último minuto. Pero este año el entusiasmo convive con bolsillos más ajustados. Para las marcas de consumo masivo, eso se juega en un lugar muy concreto: la góndola. 8 min de lectura Comportamiento del consumidor Canal Moderno & Tradicional · LATAM Hay momentos en que la demanda aparece sola. El desafío es estar disponible cuando el consumidor llega. En temporada de fútbol, la compra cotidiana cambia de ritmo. Hay partidos que reordenan la tarde, juntadas que se arman con poco aviso y visitas rápidas a la tienda antes del pitazo. Para consumo masivo, esos minutos suelen concentrar decisiones que normalmente se reparten durante la semana. La diferencia es que 2026 no llega con un consumidor relajado. Llega con ganas de reunirse, sí, pero también con más cuidado al gastar. Esa mezcla —ánimo alto y presupuesto medido— se nota rápido en la tienda: en qué se compra, qué se reemplaza y qué marca se elige cuando la favorita no está. Son las 6:30 PM. El partido empieza en una hora. Millones de personas en México, Colombia y Perú están haciendo exactamente la misma cosa: pasando por una tienda, un minimercado, o llamando a un domicilio para preparar la reunión del partido. Algunos encuentran lo que buscan. Otros no. Y los que no lo encuentran, no esperan: eligen otra marca o van al competidor de enfrente. Esa decisión puede tomar tres segundos. La venta, en cambio, ya no vuelve. El consumidor futbolero: con ganas de celebrar, pero mirando el gasto La realidad que llega antes del pitazo Para anticipar lo que viene, hay que mirar cómo llega el consumidor latinoamericano a esta temporada. No necesariamente compra menos por falta de interés: compra con más filtros, compara más y deja menos espacio para errores en el punto de venta. Los MI Monitor Colombia de marzo y abril muestran un canal que no está detenido, pero sí mucho más selectivo. En abril, las compras crecieron 3.9% en valor YTD, mientras el volumen real cayó −2.2%; el reporte lo vincula a un Índice de Precios de Abastecimiento de 6.6%, casi el doble del 3.9% de 2025. MI Monitor Colombia — Abril 2026 Marzo ya venía marcando la misma tensión: más valor que volumen, más cuidado con el desembolso y un tendero que repone con cautela. MI Monitor Colombia — Marzo 2026 −2.2% Volumen real YTD en Total Nacional al cierre de abril, pese a un +3.9% en valor. MI Monitor Colombia — Abril 2026 −4.9% Volumen YTD en Minimercados; el formato cae, aunque abril muestra un rebote de corto plazo. MI Monitor Colombia — Abril 2026 +0.1% Volumen YTD del Detallista Tradicional: bajo, pero positivo frente al resto de subcanales. MI Monitor Colombia — Abril 2026 Y sin embargo: ahí está el partido y el consumidor va a gastar. La pregunta no es si habrá consumo; habrá. La pregunta es en qué, cuándo y si tu marca va a estar disponible justo cuando se tome la decisión. Dos tipos de productos. Una misma góndola. El estrés económico no aplana el consumo: lo reorganiza. El consumidor bajo presión no deja de comprar — selecciona de forma más estratégica. Y en el contexto de la temporada de fútbol, esa selección tiene una lógica emocional muy específica. El espacio en góndola es limitado. En una semana de partidos, cada frente disponible cuenta. Categorías en el canal tradicional — comportamiento 2026 · Fuente: MI Monitor Colombia, Marzo–Abril 2026 Categoría Volumen YTD Señal Alimento de mascotas+12.2%Oportunidad Pasabocas+10.6%Alta rotación Leches líquidas+4.4%Defender disponibilidad Detergentes−12.3%Riesgo migración OTC−8.5%Alta sensibilidad precio Salsas de tomate−13.5%Revisar estrategia Fuente: MI Monitor Colombia, abril 2026. La selección destaca categorías con señales claras de oportunidad o riesgo dentro del universo TMI. Abril deja una lectura útil: el consumidor no corta todo por igual. Mascotas y pasabocas crecen en volumen, mientras detergentes, OTC y algunas salsas retroceden con fuerza. En otras palabras, los pequeños gustos y las compras de alta conexión emocional resisten mejor; lo reemplazable o más sensible a precio queda bajo presión. MI Monitor Colombia — Abril 2026 Señal clave para CPG El Detallista Tradicional es el subcanal que mejor resiste: en abril mantiene +0.1% en volumen YTD, mientras Minimercados caen −4.9% y Mayoristas −3.9%. MI Monitor Colombia — Abril 2026 En una temporada futbolera, esa proximidad pesa: es la tienda a la que el consumidor llega 40 minutos antes del partido, cuando ya no hay mucho margen para cambiar de plan. El partido también se juega en la góndola La temporada de fútbol empuja la demanda, pero no garantiza la venta. Si el producto no está en el anaquel, la intención se va a otra marca, a otro formato o a otra tienda. En consumo masivo, esa brecha suele verse tarde, cuando el cierre del mes ya no permite recuperar lo perdido. Hasta 15% de SKUs agotados en condiciones normales En bebidas, una de las categorías que más se activa con eventos deportivos, la disponibilidad puede cambiar el resultado comercial del día. Si el punto de partida ya trae OSA bajo presión, una semana de partidos no solo empuja ventas: también puede hacer más visibles los quiebres. Caso Bebidas México — Teamcore 73% de reducción en productos agotados logró una empresa de bebidas en México en 12 meses, al conectar su operación de campo con visibilidad en tiempo real. Partían de hasta 15% de SKUs agotados en anaquel y OSA inferior al 90%. Fuente: Caso de uso Bebidas — Teamcore México Descargar caso de uso → La dinámica es simple: si el consumidor quiere tu producto y no lo encuentra, resuelve con lo que sí está disponible. En semanas de alta demanda, esa sustitución ocurre muchas veces, en muchos puntos de venta y casi siempre sin avisar. Cuando el partido termina, esa compra ya quedó decidida.
Your field data is already ready. When will you use it?

Your field data is ready. When will you use it? — Teamcore Blog Retail Execution · Data Extraction Teamcore Editorial · Consumer Goods Your field data is ready. When will you use it? Point-of-sale execution generates data every day. The problem is that many operations still receive it too late, incomplete, or too disorganized to turn it into decisions. 7-minute read Data & CPG Sales Execution · Field Teams · Retail The problem isn’t a lack of data—it’s the speed at which it reaches the decision-makers. Only 12% of retailers turn data into preventive actions. The remaining 88% continue to operate with partial visibility: they identify the problem only after the sale has already been lost. Your teams are already generating the information. What’s missing is turning it into action before the point of sale takes the hit. 12% of retailers turn data into preventive actions. 7h+ are lost per chain each week managing, cleaning, and standardizing data. 10x average ROI when the operational bottleneck is eliminated. The Silent Problem That Destroys Results It’s 8:00 AM. Your flagship product sold out yesterday at 15 key retail locations. Your teams are reviewing routes, the competition is restocking their shelves, and consumers are choosing other brands. By the time you find out, it’s already too late. This scenario is no exception—it’s part of everyday life in many mass-market operations. Information about what’s happening on the shelves arrives in fragments, late, and with too much noise to act on. Sales teams spend hours downloading files, cleaning up databases, reconciling formats, and standardizing data before they can perform their first real analysis. The cost isn’t just in the time lost. It’s in the out-of-stocks detected too late, the promotions nobody corrects in time, the displays audited after the campaign has ended, and the shelf space the competition takes over while the team is still trying to sort through the information. “The difference wasn’t that the problems disappeared. It was that the team spotted them in time to do something about them.” — Teamcore Success Story · Health & Beauty · Peru 2025 The bottleneck isn’t in the quality of your teams. It’s in the gap between the data generated in the field and the people who need to act on it. Teamcore Data Extraction exists to bridge that gap. What Is Teamcore Data Extraction? Data Extraction is the operational intelligence layer of the Teamcore platform that transforms everything that happens at the point of sale—visits, execution tasks, photographic evidence, field responses—into structured, downloadable, and actionable data in real time. It’s not just a simple report exporter. It functions as a conversion engine: it takes the scattered field data from thousands of merchandisers and supervisors and transforms it into a standardized, filterable data sheet ready for strategic analysis. Current Module: Standard KPI Downloader—historical sell-out, inventory, and availability metrics. Up to 2 years of data plus the current period in a single parameterized query. Current Module: Execution Downloader Comprehensive data sheet of field responses: task type, user, store, product down to the SKU level, time range, and links to photographic evidence. Current Module: Photo Downloader PDF download with advanced filters. Visual audit of the actual condition of the shelf without relying on manual reports. In Development: Smart Downloader The next evolution: smart KPIs with built-in AI to automatically prioritize alerts with the greatest impact on sales. How It Works: From the Field to Decision-Making The promise is simple: analysts start generating insights from the very first minute, not the seventh hour. 1 Execution via Mobile App Field teams complete facing, display, and promotional tasks through the app. Each response is automatically synchronized upon check-out, including georeferenced photographic evidence. 2 Processing in Datapipe Teamcore’s data engine normalizes, enriches, and structures the information in real time, cross-referencing execution data with sell-out, inventory, and sales targets. 3 Query Configuration From the web platform, the analyst configures the data download: task type, user attributes, store attributes, product down to the SKU level, and exact time range. 4 Download Ready for Analysis The data sheet arrives clean, standardized, and structured. Zero preparation work. The team can move directly from insights to action. The real cost of not having this data on time: An 1% drop in shelf availability can represent millions in lost revenue per year. But the damage isn’t just financial: every day without visibility pushes the team toward reaction rather than prevention. Without automation: 7 hours and 10 minutes per chain each week just on data management, cleaning, and standardization. With Teamcore: 26 minutes per chain each week. The difference isn’t in producing more reports; it’s in freeing up time for decision-making. A 93% reduction in data management time. In an operation with 9 lines, that equates to 3,150 hours freed up per year for analysis, prioritization, and action at the point of sale. The Big Picture When information arrives clean and on time, the conversation changes: the team stops asking “what happened” and starts deciding “what do we do now?” That difference separates reactive operations from proactive ones. Teamcore’s Overall Impact in Numbers Operational visibility doesn’t just organize information. It also improves the ability to recover sales, maintain availability, and resolve incidents before they escalate. An average of +75% in recovered sales with real-time operational visibility. 6–9% improvement in product availability on store shelves. −11.5% reduction in incident resolution time at the point of sale. +23% optimization of team time at the point of sale. For a retail operation, these numbers mean less time wasted on repetitive tasks and more capacity to act where sales happen: at the point of sale,
How the 2026 Tournament is changing retail execution in LATAM
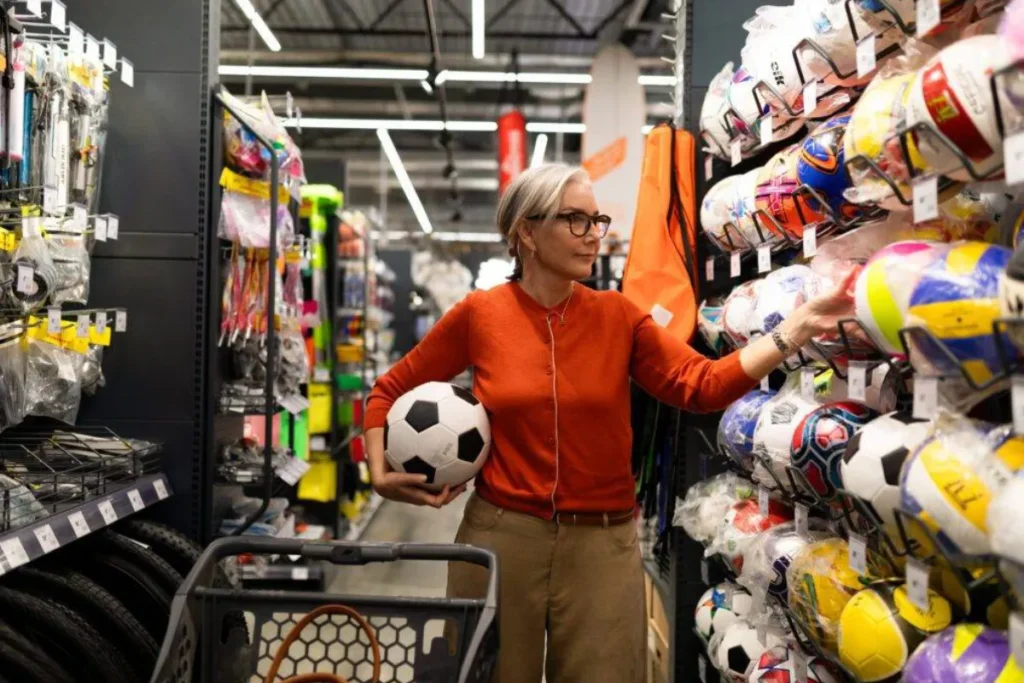
How the 2026 World Cup Is Changing Retail Execution in Latin America Subscribe April 24, 2026 The World Cup Isn’t Just Played on the Field Matches aren’t just played in stadiums.They’re played on every shelf, in every store, in every execution decision. When 10 teams from Latin America compete in the biggest tournament in history, millions of consumers rethink their shopping habits. For CPG companies, this opens a critical window: capture growth… or lose it to the competition. And that window lasts just 39 days. +30% expected uptick in categories such as beer, snacks, and soft drinks (Kantar / Expansión, Feb. 2026) An additional $395M USD projected for the retail sector in Mexico (Monitor Deloitte, Feb. 2026) 10 Latin American teams driving consumption across the region (FIFA / Milenio, Apr. 2026) The impact is not marginal. It is structural. The problem: most brands aren’t in optimal shape. Because at events like this, execution—not strategy—determines who wins. The 5 moves that determine the outcome 1. Commercial Planning Map out your winning categories before kickoff Not all categories react the same way. Beverages, snacks, beer, and cold cuts account for the highest spikes, with increases of up to 30% during periods of high demand (Kantar / Expansión, Feb. 2026). Companies that capitalize on these moments don’t wing it: they analyze past events (Copa América, qualifiers), forecast demand, and adjust their product mix in advance. The costliest mistake isn’t failing at marketing—it’s running out of product when the consumer is ready to buy. 2. Point-of-Sale Execution The battle is won on the shelf, not in the brief. You may have the best campaign of the tournament. If the product isn’t available, well-displayed, and priced correctly, there’s no sale. During the Big Tournament: foot traffic rises, the pace of purchasing increases, and the margin for error disappears. The value of the tournament isn’t automatic.It is built through operational discipline. Adjusting inventory and ensuring availability before demand peaks is critical to capturing the economic value of the event (Monitor Deloitte, Feb. 2026). 3. Traditional Channel: Where the Game Is Also Played Growth isn’t limited to the modern channel. Neighborhood stores, general stores, and local retail outlets capture a significant share of consumption, especially during social occasions: home games, gatherings, and last-minute purchases. In markets like Colombia, the traditional channel can see increases of nearly 45% during key games, especially in categories such as snacks and beverages (Fenalco / America Retail, Nov. 2024). Strategies focused solely on supermarkets leave money on the table. People watch the game wherever they can.The product has to be there. 4. Real-Time Execution Total visibility when it matters most During the event, a slow reaction means losing out. A stockout during the week of your national team’s game could mean losing sales for the entire season (Monitor Deloitte, Feb. 2026). Decisions can’t wait for weekly reports—they’re made in a matter of hours. This is where execution becomes a real competitive advantage: detect stockouts before they impact sales; prioritize store visits based on commercial impact; focus the field team on key stores; react in real time. The brands that win aren’t the ones that look at the most data.They’re the ones that act on it fastest. 5. Post-Tournament Analysis The wrap-up is where your competitive advantage begins. Many companies celebrate the results… and miss out on the lessons. The tournament leaves behind more than just sales.It leaves critical information: which stores outperformed; which SKUs sold out early; where execution fell short; which decisions actually made an impact. In addition to boosting consumption, the tournament will also have a significant macroeconomic impact, generating jobs and boosting GDP (Deloitte Monitor, Feb. 2026). The brands that turn these insights into action are the ones that will win the next cycle. The Tournament is a test of execution, not of budget. The 2026 Grand Soccer Tournament isn’t just a sporting event—it’s a test of commercial maturity for CPGs in Latin America. The brands that gain market share won’t necessarily be the ones that invest the most in advertising. They will be the ones that: reach the point of sale with the right portfolio, execute consistently, and react in real time when something deviates from the plan. The opening kickoff is on June 11. Preparation starts now. In 39 days, you can seize a unique opportunity… or let your competition do it for you. Sources: Kantar / Expansión — Proximity, Value, and Soccer: The 3 Keys to Capturing Consumer Spending (Feb. 2026) Monitor Deloitte — Retail Will See $395 Million in Sales Due to the 2026 World Cup in Mexico (Feb. 2026) Fenalco / America-Retail — The impact of the qualifiers and soccer on retail (Nov. 2024) FIFA / Milenio — Complete list of teams qualified for the 2026 World Cup (Apr. 2026) El Financiero — Consumer companies expect to ‘score a goal’ in sales thanks to the World Cup (Mar. 2026) Previous PostNext Post Latest Posts All Posts Blog Your field data is ready. When will you use it? The tournament begins. Your shelf is in the game, too. How the 2026 Tournament is changing retail execution in Latin America Subscribe to our newsletter for free. Read More skip render: ucaddon_post_carousel
Internal insights vs. external studies: two sources, a single decision
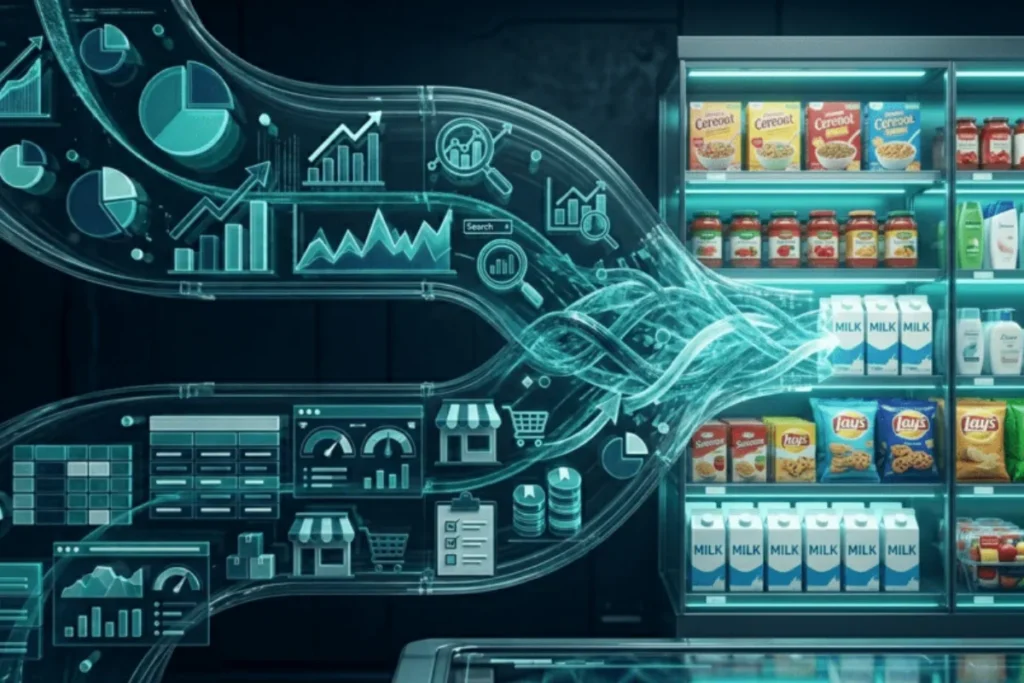
In-House Insights vs. External Research: Two Sources, One Decision Most companies have access to more data than ever before, but they continue to operate with disconnected sources. In this article, we explore how to integrate external market research with internal business data to bridge the gap between strategy and execution at the point of sale. Subscribe April 8, 2026 Information was never the problem. The problem was always what to do with it. In 2026, most consumer goods companies have access to more data than ever before. And yet, many continue to make decisions blindly—not because of a lack of information, but because their data sources don’t communicate with one another. Two parallel worlds that never intersect. And a huge gap between what the strategy says and what happens at the point of sale. What Market Research Tells You (and What It Doesn’t) Studies on market share, consumer behavior, and category trends remain key tools. No one disputes that. They help you understand the context: how your category is growing, where the competition stands, and what trends are emerging. They are the map of the territory. In fact, according to Kantar, the companies that are succeeding in retail are those that combine advanced analytics with a clear understanding of consumer behavior to identify growth opportunities before the competition does. But they have a very specific limitation: they don’t tell you where to act tomorrow. The frequency of updates is low. The level of aggregation is high. And when you want to drill down to a specific point of sale, the information becomes vague. They’re useful for planning medium- and long-term strategies, not for executing this week. The asset you already have—and are probably underutilizing—Meanwhile, your own operations generate a massive amount of data every day: Sales by SKU Distributor data Field execution Price and promotion histories Sales route compliance This information offers something no external study can provide: true granularity, daily frequency, and direct insight into what’s happening in the business. The problem is that in most organizations, this data is used to report on the past, not to guide the future. What happens when these data sources aren’t connected? The result is usually the same: well-designed strategies that are poorly executed. A study might show that a category is growing strongly in a particular region. That’s an excellent sign. But without the operational data to cross-reference it, it’s impossible to answer the questions that really matter: At which specific retail locations should we take action? Which products should be prioritized? What is the field team doing this week? This isn’t a new problem. The Harvard Business Review warns that most decision-making errors stem not from a lack of data, but from a failure to properly integrate available internal and external sources. The approach adopted by the most advanced organizations: It’s not about choosing between external studies and internal data. It’s about understanding that they serve different purposes and that, together, they are far more powerful. Studies provide context and strategic direction. Internal data enables precise and rapid execution. When they are well integrated, the result changes significantly: Opportunities are identified earlier; sales channels with the greatest potential impact are prioritized; strategies are adjusted in much shorter cycles; planning is linked to actual execution; and the real impact is on the ground. All of this makes sense when it reaches the point of sale. Integrating data sources isn’t just an analytical exercise. It’s an execution tool. When it works well, sales teams head out into the field with clear priorities, not just intuition. That transforms every visit: greater focus, greater effectiveness, and measurable results. Why Technology Is the Bridge Doing this integration manually isn’t scalable. It requires too much time, too many intermediaries, and too many analysis cycles. That’s why more and more organizations are adopting platforms that unify these sources and turn information into actionable decisions—tools that connect data from distributors, points of sale, and sales operations, and translate them into concrete tasks for field teams. Information ceases to be a passive asset. It becomes a real competitive advantage. The real difference in 2026 In an environment where all companies have access to similar information, the difference will not lie in who has more data, but in who manages to: Intelligently integrate different sources Reduce the time between insight and action Execute with a focus on the areas of greatest impact Measure results and learn quickly Companies that continue to operate with disconnected data sources will have a partial view of the business. Those that manage to integrate them will be better prepared to compete in increasingly demanding markets. Market research and internal data do not compete with each other. They complement each other. But only when they are properly integrated can they bridge the gap between strategy and execution. By 2026, the most effective business decisions will not come from looking at a single source; they will come from building a comprehensive view that enables precise action at the point of sale. Previous Post Latest Posts All Posts Blog In-House Insights vs. External Studies: Two Sources, One Decision Commercial Execution in the Traditional Channel: What Has Changed Retail Business Data: The Gap Between What You See and What Happens at the Point of Sale Subscribe to our free newsletter. Read More skip render: ucaddon_post_carousel
Commercial execution in the traditional channel: what changed
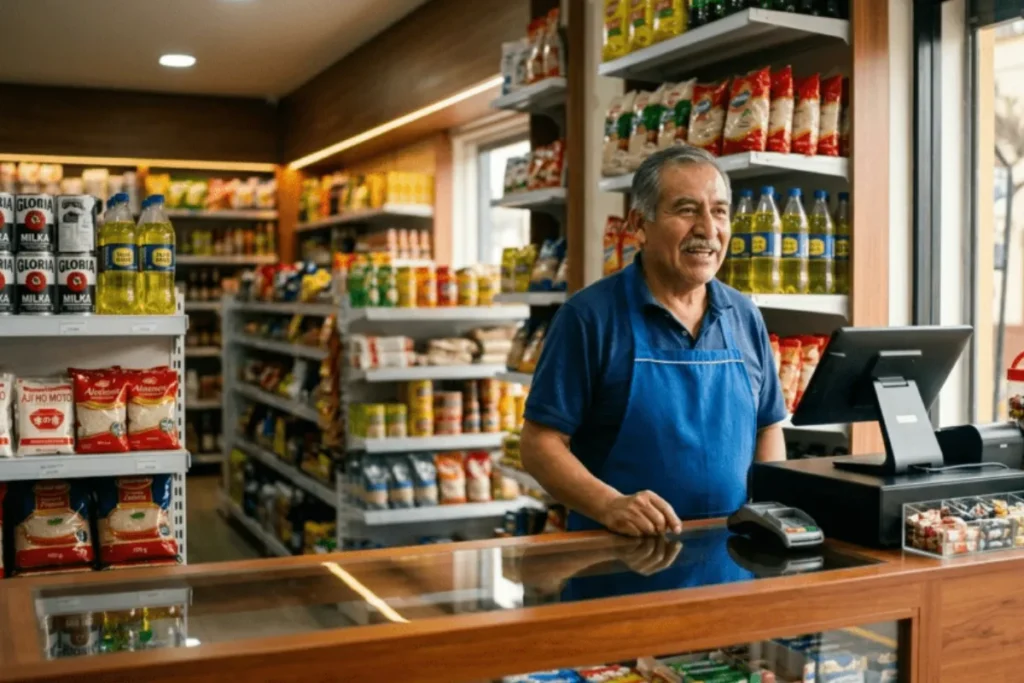
Retail Data: The Gap Between What You See and What Happens at the Point of Sale The traditional channel remains the top revenue generator in Latin America. It’s also the worst-managed. In 2026, continuing to operate with processes from ten years ago isn’t just inefficient—it’s a real strategic risk. Subscribe March 10, 2026 Tens of thousands of grocery stores, convenience stores, and neighborhood shops. Teams of salespeople on the ground. Distributors with their own ways of doing things. Commercial terms that vary by region, by customer, and by week. That’s the traditional channel in Latin America. And for many consumer goods companies, it’s also the channel that generates the most revenue—and the one that’s managed the worst. Not because of a lack of resources. But because most organizations still apply processes designed for a different context, a different pace, and a different level of complexity. In 2026, managing commercial execution in the traditional channel with tools from ten years ago isn’t just inefficient. It’s a real strategic risk. The Channel Whose Complexity Keeps Growing The traditional channel isn’t disappearing. On the contrary: it remains the primary point of purchase for millions of consumers in urban and outlying areas of Latin America, with structural advantages that modern retail cannot easily replicate. Widespread territorial coverage that no chain can match; proximity to consumers and frequent replenishment purchases; penetration into segments and areas where supermarkets do not reach; and flexibility in product assortment and pricing based on local context. But those same advantages create the main operational challenge: scale and fragmentation. When you have thousands of active retail locations, multiple distributors, and salespeople managing vast territories, visibility becomes a serious problem. And without real visibility, commercial execution in the traditional channel is managed by intuition. The mistake of copying the modern retail model One of the most common patterns in large companies: attempting to apply the same management logic that works for supermarket chains to the traditional channel. In modern retail, information is centralized. There are direct integrations, reliable sell-out data, and visible inventory levels. The system works because the channel is structured to share data. In the traditional channel, the reality is different: Information arrives filtered through the distributor; update frequency is irregular or nonexistent; point-of-sale visibility depends almost exclusively on the salesperson in the field; conditions vary so much between stores that a standard model does not scale. Applying modern retail tools to the traditional channel does not provide control. It creates a false sense of control. And that’s worse. By the time the information arrives, the sale has already been lost. Many organizations still operate with weekly reports, Excel consolidations, and data that arrives days or weeks after the problem occurred in the market. The practical result is always the same: Stockouts that are detected only after they’ve already impacted sales; growth opportunities that no one identifies in time; unfocused sales visits, where the salesperson decides intuitively whom to visit; field teams that are reactive rather than prioritized. In a channel where competitors can react quickly and where consumers have alternatives just a few meters away, decision-making speed is not an advantage—it’s a minimum requirement for competing. The new complexity no one saw coming. If the traditional retail channel was already complex, recent years have made it even more demanding. Today, consumer goods companies face a combination of pressures in this channel that did not previously coexist: Greater competition among brands for the same shelf space; Consumers who are more price-sensitive and switch brands with less hesitation; Shorter promotional cycles that are difficult to execute consistently; Pressure on the productivity of field teams; The need for faster decisions based on more fragmented data. This context makes the model of reactive management model unsustainable. And it’s the starting point for understanding why commercial execution in the traditional channel needs a qualitative leap forward. From Retrospective Reports to Intelligent Execution The first step most organizations take is to improve visibility: dashboards, more frequent reports, and integration of distributor data. It’s necessary. But it’s not enough. Visibility without action is merely documentation of the problem. The next step—which is where real impact is generated—is to convert that information into concrete operational instructions for the field team. Managing sales execution in the traditional channel in a modern way involves four things: Identifying opportunities with real impact Not every deviation warrants a visit. The key is to rank issues by sales recovery potential, not by the volume of available data. Prioritize retail locations, not territories. A sales rep cannot visit every store in their area every day. They need to know exactly which store to visit today—and why that one first. That requires a prioritization model, not a map. Translate the analysis into actionable tasks «SKU X dropped 15% in the northern zone» is not an instruction. «Store Y—check SKU X’s facing—probable cause: stockout» is. The difference between the two is the difference between visibility and execution. Measure whether the problem was resolved The cycle isn’t complete when the recommendation is issued. It’s complete when it’s confirmed that the task was executed and that the impact on sales was as expected. Without that feedback loop, there’s no organizational learning. The role of technology: to guide, not just to measure The global retail analytics market exceeds $6 trillion and is growing at double-digit rates (Mordor Intelligence). But in the traditional retail channel, most of that investment remains focused on visibility, not execution. The technology that truly moves the needle in this channel is the kind that connects three elements within a single workflow: point-of-sale data, intelligent prioritization, and tasks assigned to a specific person. Artificial intelligence plays a specific role in this workflow: it detects anomalies before they escalate—such as imminent stockouts or sales drops.
Retail business data: the gap between what you see and what happens at the point of sale
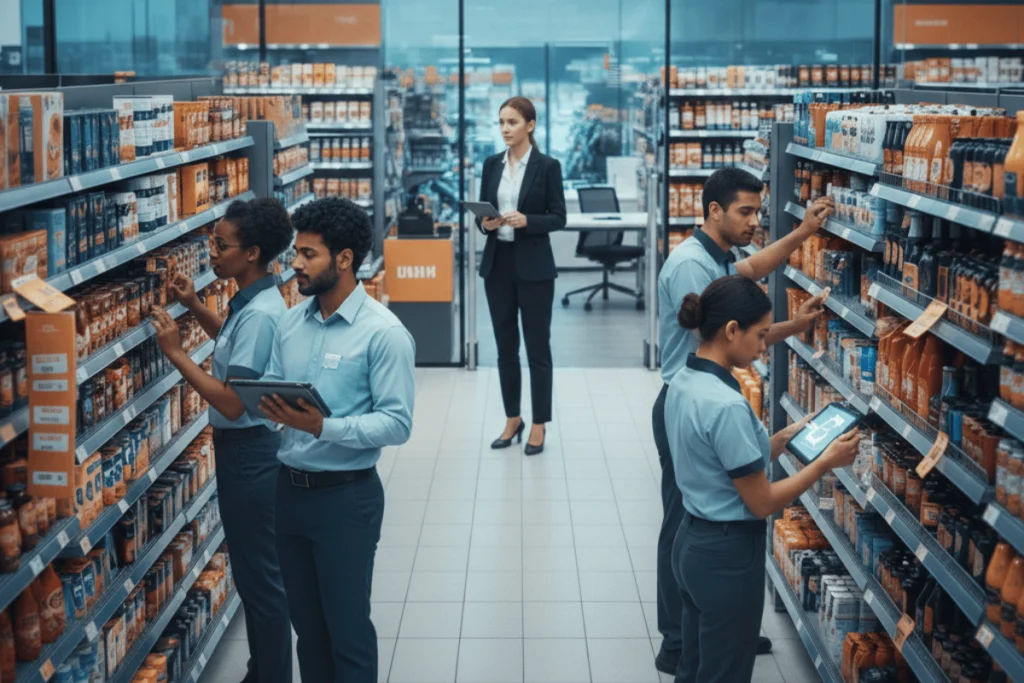
Retail Business Data: The Gap Between What You See and What Happens at the Point of Sale Subscribe February 19, 2026 You have dashboards. You have KPIs. You have an analytics team that could work at Google. And yet, the gaps keep appearing. Promotions aren’t being executed. The field team prioritizes based on instinct. The problem isn’t a lack of retail business data. It’s that that data never quite translates into action. Why Having More Data Doesn’t Lead to More Sales Over the past five years, consumer goods companies have invested heavily in visibility: sell-out by SKU, route coverage, photographed execution, real-time pricing. The paradoxical result: we’ve never had so much information, and it’s never been so hard to know what to do first. Why? Because most platforms are designed to show what happened, not to tell you what to do right now. A Trade Marketing Director doesn’t need another report. They need clear answers to three questions: Which retail location should I address today, and why that one first? What specific action does my field team need to take? How do I know if the problem was resolved? When those answers require cross-referencing five systems and two hours of manual analysis, speed goes out the window. And in retail, speed equals profit margin. The «pretty dashboard» syndrome There’s a recurring pattern in organizations of all sizes: extremely high analytical sophistication, but average execution on the ground. According to a Gartner study, 61% of marketing leaders report not having the internal capabilities to execute their strategy (Gartner, 2022). That data is from 2022, but the problem has worsened: by 2025, 84% of CMOs report active strategic dysfunction (Gartner, 2025). The BI team delivers a flawless report showing that SKU A dropped by 18% in the northern region. Perfect. Now what? Now someone has to decide which of the 400 stores in the northern region to visit this week. What to tell the sales associate. Whether the problem is stockouts, pricing, or planograms. And whether the intervention will yield any meaningful results. An insight without an assigned task is just decorative information. Retail business data only creates value when it leads to a specific action, executed by a real person, in a specific location. From descriptive analytics to intelligent execution The shift in mindset isn’t technological. It’s operational. It’s about redesigning the entire workflow: from data to action at the point of sale. Prioritize by impact, not by apparent urgency. Not every deviation warrants a visit. The key is to weigh the potential for sales recovery against the cost of intervention. That requires models, not intuition. Automatic translation of insights into tasks The analytical finding must reach the sales associate as a clear instruction: “Store X—check the facing of SKU Y—probable cause: stockout.” Not as a number on a dashboard that the supervisor has to interpret. Ownership defined by role. Every recommendation needs an owner: sales associate, supervisor, trade marketing, or logistics. Without explicit assignment, the recommendation dies in a meeting. Closing the loop with impact measurement The system must confirm whether the task was executed and whether it made a difference. This closed loop turns retail business data into real organizational learning, not just historical reports. Where AI Comes In (and Where It Doesn’t Replace Human Judgment) The global retail analytics market will exceed $39 trillion over the next five years (Mordor Intelligence). But market size isn’t the problem. The problem is the gap between investment in analytics and results in execution. In the Traditional Channel, with thousands of active points of sale, manual prioritization is unfeasible. That’s where artificial intelligence plays a very specific role: Detecting anomalies before the problem escalates (imminent stockout, atypical sales drop) Rank points of sale by recovery potential using historical behavior Suggest the action most likely to be effective in that specific context Reduce the sales team’s analytical workload so they can focus their energy on execution What AI does not do: replace the Trade Marketing Director’s judgment regarding commercial policy, channel relationships, or portfolio decisions. That judgment remains a human one. AI doesn’t give you more data. It gives you better answers to questions in less time. The three characteristics of organizations that do succeed There is a clear pattern among those who manage to bridge the gap between analysis and execution: They integrate visibility and action into a single operational workflow. These aren’t separate systems: reporting and tasks reside on the same platform. They simplify decision-making on the ground. The salesperson doesn’t analyze. The salesperson executes the instruction that someone else has already processed for them. They measure real impact, not activity. They don’t count visits. They track whether the issue was resolved and how much sales were recovered. This approach guides the development of solutions like those from Teamcore, where retail business data doesn’t end up in a report but rather in prioritized, measurable tasks for each team member. The Real Question for 2026 According to Gartner, 94% of CMOs say that translating strategic directives into actionable plans is a real challenge (Gartner, 2025). In retail, that challenge plays out at the point of sale, not in the boardroom. Competitive advantage no longer belongs to whoever collects the most data. It belongs to whoever acts fastest on the data they already have. Is your organization turning its retail business data into real decisions, or into increasingly comprehensive dashboards that no one has time to analyze? What’s next? If you lead Trade Marketing at a consumer goods company and want to understand how to bridge the gap between analysis and execution at the point of sale, we can show you how it works in practice. Previous PostNext Post Latest Posts All Posts Blog In-House Insights vs. External Studies: Two Sources, One Decision Commercial Execution in the Traditional Channel: What Has Changed Business Data